
A Doji candlestick is a common candlestick pattern that indicates indecision in the market. It occurs when the opening and closing prices of a stock or other asset are nearly the same, forming a small or non-existent real body. The Doji suggests that neither buyers nor sellers are in control, and it often precedes a potential reversal or continuation in the market trend.
Characteristics of a Doji Candle
1. Open and Close Prices are Similar:
– The candlestick has a very small or no real body.
2. Shadows (Wicks):
– The upper and lower shadows (lines above and below the body) can vary in length, reflecting market volatility.
3. Indecision:
– A Doji indicates that neither buyers nor sellers had a significant advantage during the session.
Types of Doji Candlestick Patterns
There are several variations of the Doji, each providing unique insights depending on its position within a trend:
1. Neutral Doji
– Appearance: The opening and closing prices are nearly the same, with upper and lower shadows of similar length.
– Interpretation: Indicates indecision and a possible pause in the current trend.
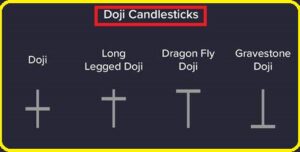
2. Long-Legged Doji
– Appearance: The opening and closing prices are close, but the upper and lower shadows are significantly long.
– Interpretation: Reflects strong market volatility and a tug-of-war between buyers and sellers.
3. Dragonfly Doji
– Appearance: The Doji has a long lower shadow and little to no upper shadow.
– Interpretation: Can indicate a bullish reversal if it appears after a downtrend.
4. Gravestone Doji
– Appearance: The Doji has a long upper shadow and little to no lower shadow.
– Interpretation: Suggests a bearish reversal if it appears after an uptrend.
5. Four-Price Doji
– Appearance: A rare pattern where the open, high, low, and close are the same, resulting in no shadows.
– Interpretation: Represents extreme indecision, typically in very low-volume trading environments.
What Does a Doji Indicate in Trading?
1. Indecision or Pause:
– A Doji often appears when buyers and sellers are equally matched, causing uncertainty in the market.
2. Reversal Signals:
– In a downtrend, a Doji may signal that selling pressure is weakening, potentially leading to a bullish reversal.
– In an uptrend, a Doji may indicate that buying pressure is losing strength, suggesting a bearish reversal.
3. Continuation Patterns:
– In some cases, a Doji may simply signal a pause in the current trend rather than a reversal.
How to Use the Doji Pattern in Trading
1. Identify Trends:
– A Doji in an uptrend may signal a reversal to the downside.
– A Doji in a downtrend may suggest a reversal to the upside.
– In a sideways market, it indicates ongoing indecision.
2. Confirm with Volume:
– Look for changes in trading volume accompanying the Doji. High volume during a Doji can indicate stronger signals of a potential trend change.
3. Combine with Other Indicators:
– Use support and resistance levels, moving averages, or RSI to confirm the Doji’s implications.
4. Wait for Confirmation:
– A Doji alone is not a strong signal. Look for confirmation in the next candle:
– A bullish candle after a Dragonfly Doji confirms a bullish reversal.
– A bearish candle after a Gravestone Doji confirms a bearish reversal.
How to Trade with Doji Candles
1. Context is Key:
A Doji on its own doesn’t provide a strong signal. Consider the trend and other indicators for confirmation.
2. Confirm with the Next Candle:
If a Doji appears after a downtrend and the next candle is bullish, it confirms a potential bullish reversal.
Similarly, a bearish candle after a Doji in an uptrend confirms a bearish reversal.
3. Use Other Tools:
Combine the Doji pattern with support and resistance levels, moving averages, RSI, or MACD for stronger signals.
Example of Doji in a Chart
Example 1
Imagine a Dragonfly Doji appears after a downtrend. If the next candle is bullish and breaks a resistance level, it could confirm a bullish reversal, making it a potential entry point for a trade.
Example 2
Scenario: A Dragonfly Doji appears at the bottom of a downtrend, near a support level.
Action: Wait for the next candle to close above the Dragonfly’s high as confirmation before entering a long trade.
Important Links
Join on Telegram
WhatsApp Group
Follow on Facebook
Welcome to this official website of JOBSINDIA
There are a lot of similar website namely JOBSINDIA, so be careful to click on other website. Use our official Url :https://jobsindia.org.in to visit our site. You can also connect with us on social media platforms like Facebook, Twitter, Instagram, Telegram, WhatsApp and YouTube.
Disclaimer
Information provided on JOBSINDIA is for informational purposes only and does not constitute financial, investment, or trading advice. All content on this site, including news, analysis, opinions, and recommendations, is based on publicly available data and is believed to be accurate at the time of publication. However, we make no representations or warranties regarding the accuracy, completeness, or reliability of any information on this website.
Investing in the stock market involves significant risk, and past performance is not indicative of future results. The value of investments can fluctuate, and you may lose money. You should consult with a qualified financial advisor or do your own research before making any investment decisions.
JOBSINDIA and its owners, employees, or affiliates are not liable for any losses, damages, or other consequences arising from the use or reliance on any information contained on this website.
By using this website, you acknowledge that you understand and agree to this disclaimer.