Most useful candlestick patterns in Share Market
Candlestick charts are widely used in technical analysis to analyze price action in the stock market. Certain candlestick patterns are considered especially useful because they can signal potential market reversals or continuation of trends. Below are some of the most useful candlestick patterns:
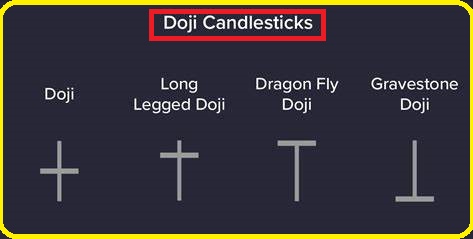
1. Doji
- Description: A Doji is formed when the opening and closing prices are nearly the same. It signifies indecision in the market.
- Indication: A Doji can signal a potential reversal, especially after a strong uptrend or downtrend. However, the context of the pattern (previous trend and surrounding candles) matters for confirmation.
- Example: If a Doji appears at the top of an uptrend, it could indicate a potential reversal to the downside (bearish Doji). If it appears at the bottom of a downtrend, it might signal a bullish reversal.
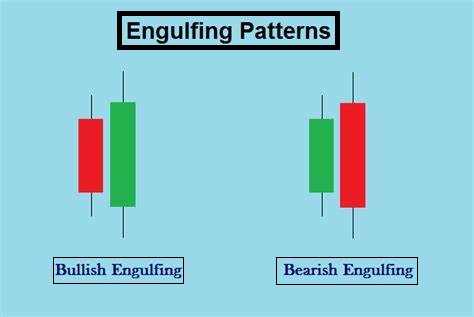
2. Engulfing Patterns
- Bullish Engulfing: A large bullish (green) candle fully engulfs the previous bearish (red) candle. This pattern suggests strong buying interest and a potential reversal from downtrend to uptrend.
- Bearish Engulfing: A large bearish (red) candle fully engulfs the previous bullish (green) candle. This pattern suggests strong selling interest and a potential reversal from uptrend to downtrend.

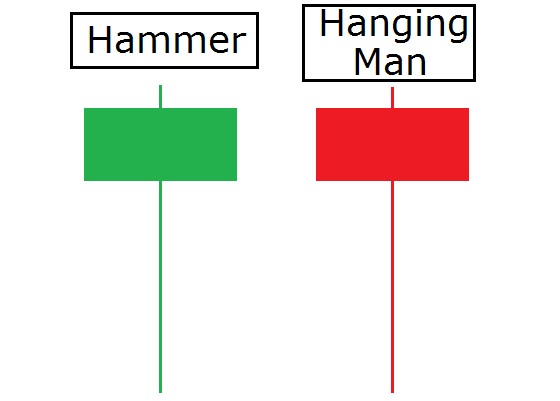
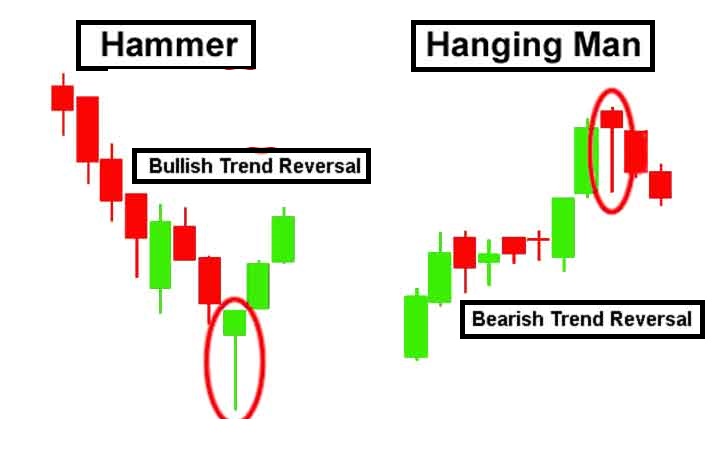
3. Hammer and Hanging Man
- Hammer: A candlestick with a small body and a long lower shadow, typically found at the bottom of a downtrend. It suggests that buyers are gaining control after sellers have tried to push the price lower.
- Hanging Man: Similar to the hammer, but appears after an uptrend. It can signal that the market might reverse to the downside.
- Indication: Both patterns indicate potential trend reversal, but confirmation is needed in the form of the next candle or other indicators.
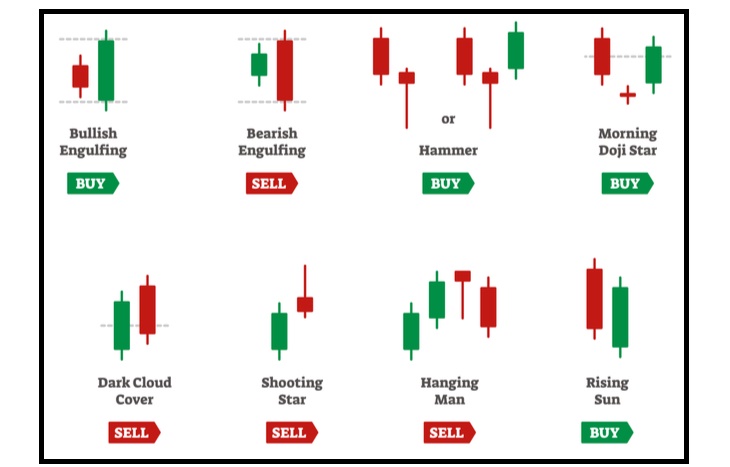
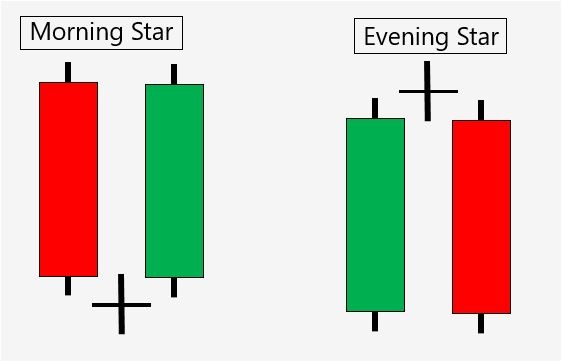
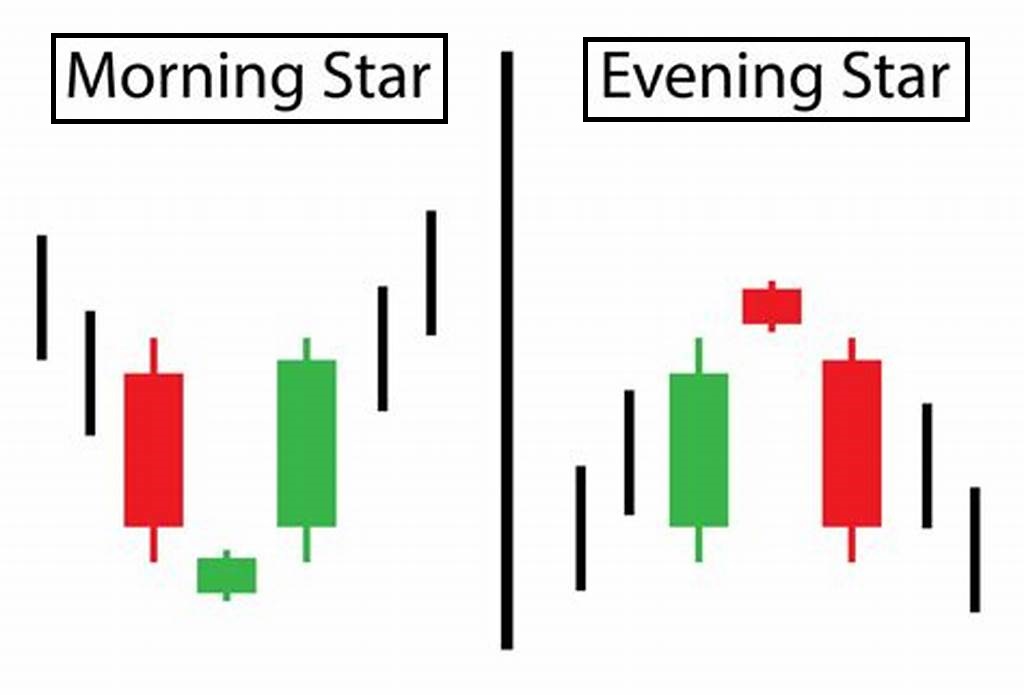
4. Morning Star and Evening Star
- Morning Star (Bullish Reversal): A three-candle pattern that forms after a downtrend. The first candle is bearish, followed by a small-bodied candle (could be Doji), and then a large bullish candle. This suggests a reversal from a downtrend to an uptrend.
- Evening Star (Bearish Reversal): A three-candle pattern after an uptrend. The first candle is bullish, followed by a small-bodied candle, and then a large bearish candle. This signals a potential reversal from an uptrend to a downtrend.
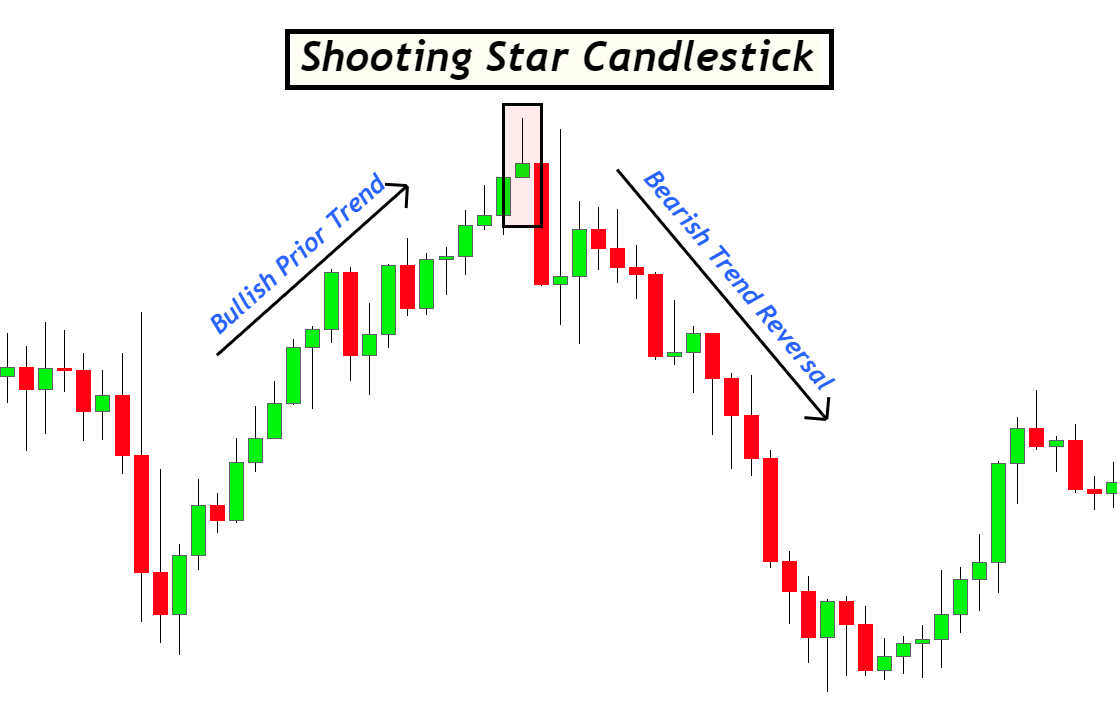
5. Shooting Star
- Description: A candlestick with a small body and a long upper shadow, typically found after an uptrend. It suggests that buyers tried to push the price higher but were overwhelmed by sellers.
- Indication: A shooting star at the top of an uptrend is a bearish signal. It indicates that the upward momentum is weakening, and a reversal to the downside could be imminent.

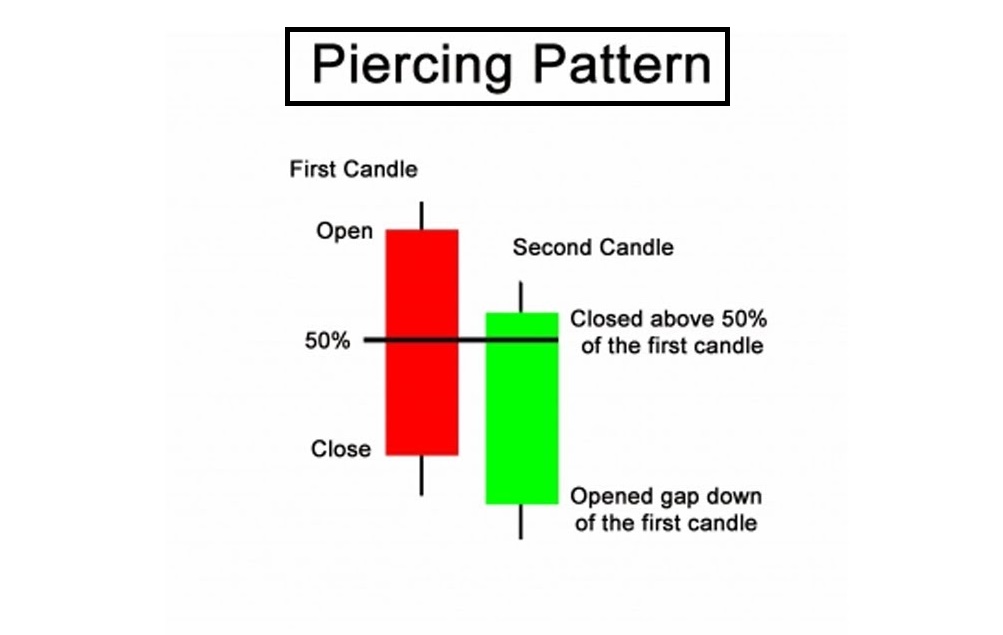
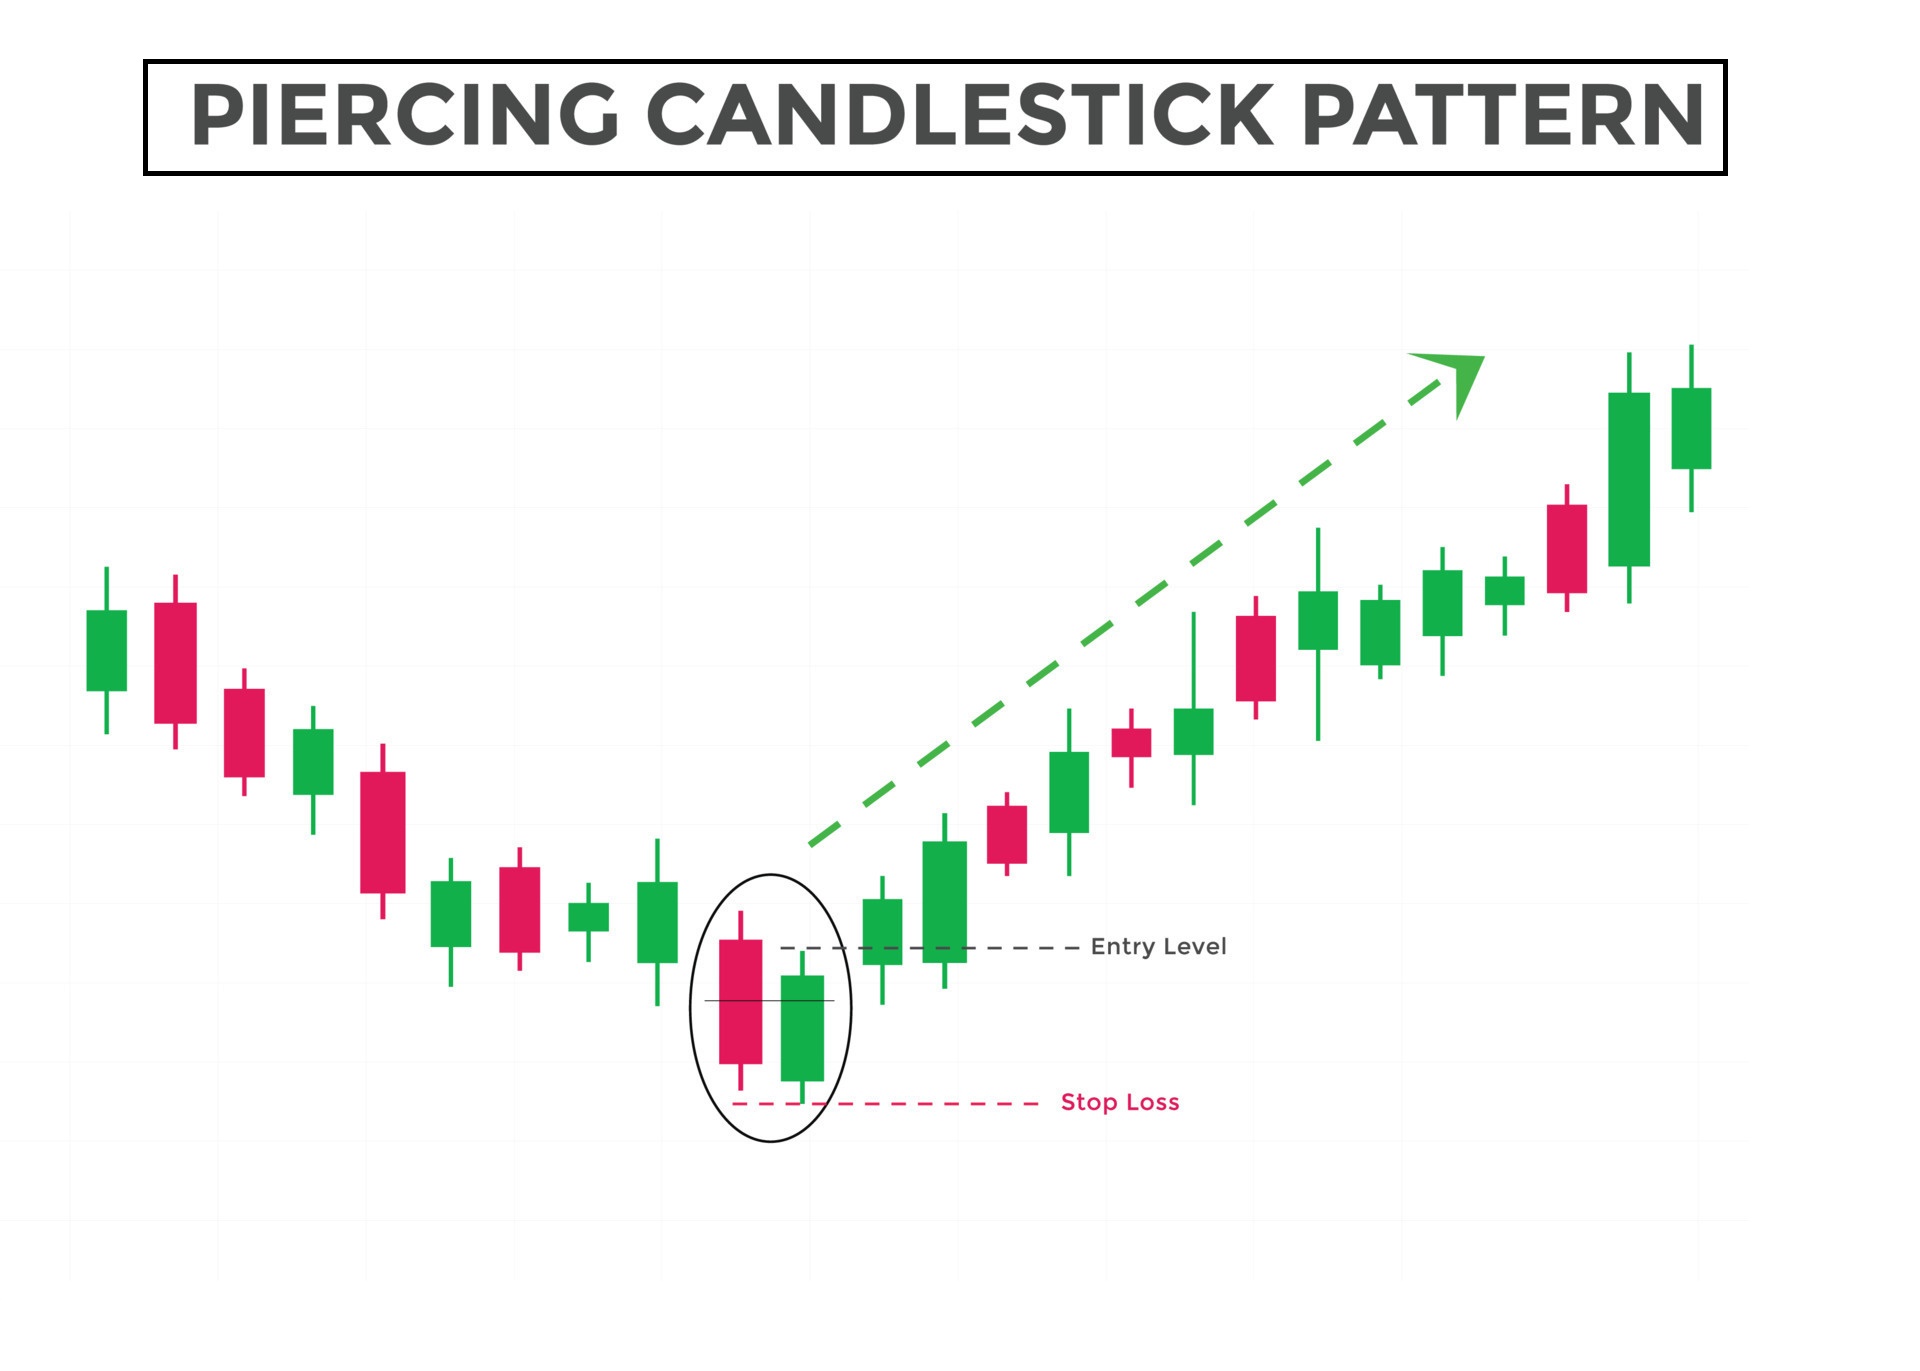
6. Piercing Pattern
- Description: A two-candle pattern that forms during a downtrend. The first candle is bearish, followed by a bullish candle that opens lower but closes above the midpoint of the previous bearish candle.
- Indication: It signals a potential reversal to the upside, indicating that bulls may be gaining control.
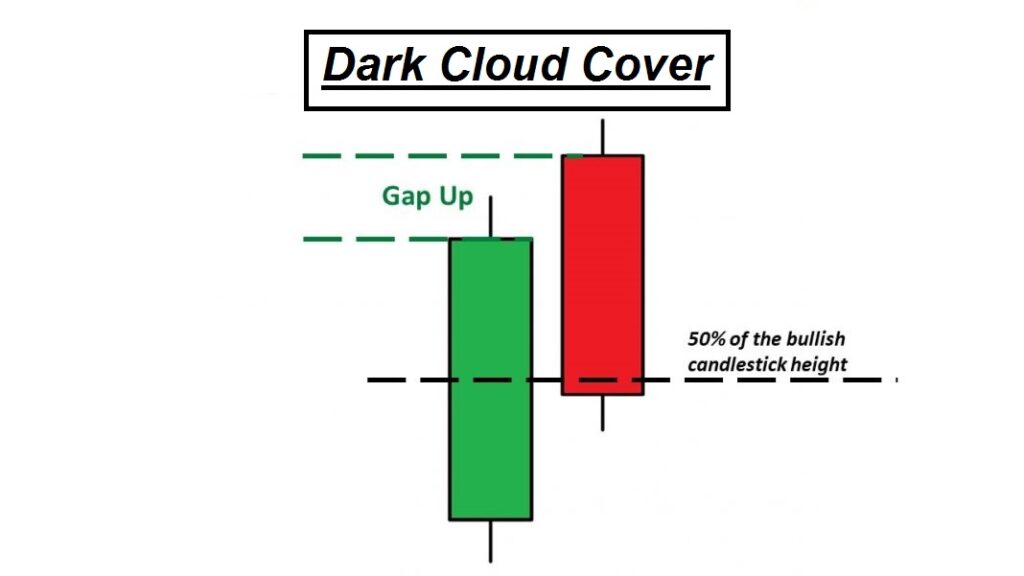
7. Dark Cloud Cover
- Description: A two-candle pattern that forms during an uptrend. The first candle is bullish, and the second candle opens above the previous candle’s high but closes below the midpoint of the first candle.
- Indication: This is a bearish reversal pattern, indicating that the bulls have lost control and the market may turn downward.

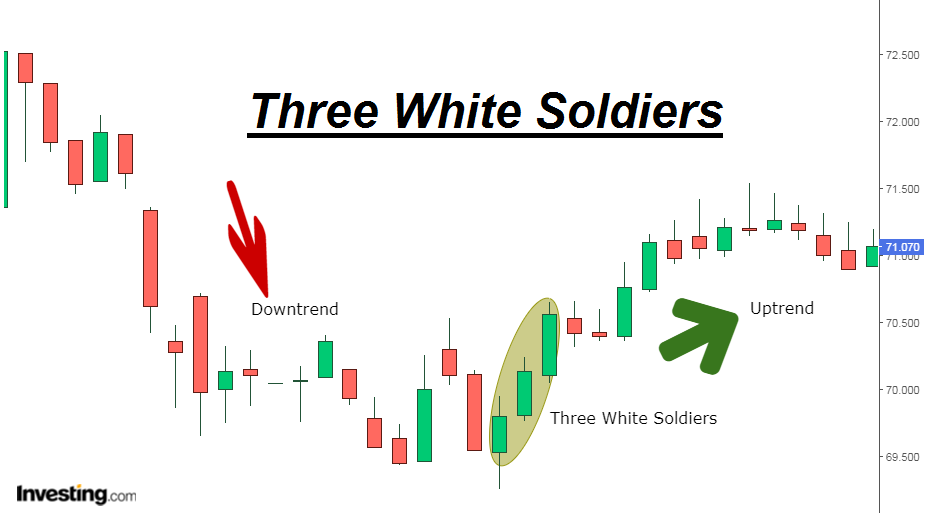
8. Three White Soldiers
- Description: Three consecutive long bullish (green) candles with small or no wicks. It typically appears after a downtrend and suggests strong buying pressure.
- Indication: This is a bullish continuation pattern, signaling that the trend is likely to continue upward.

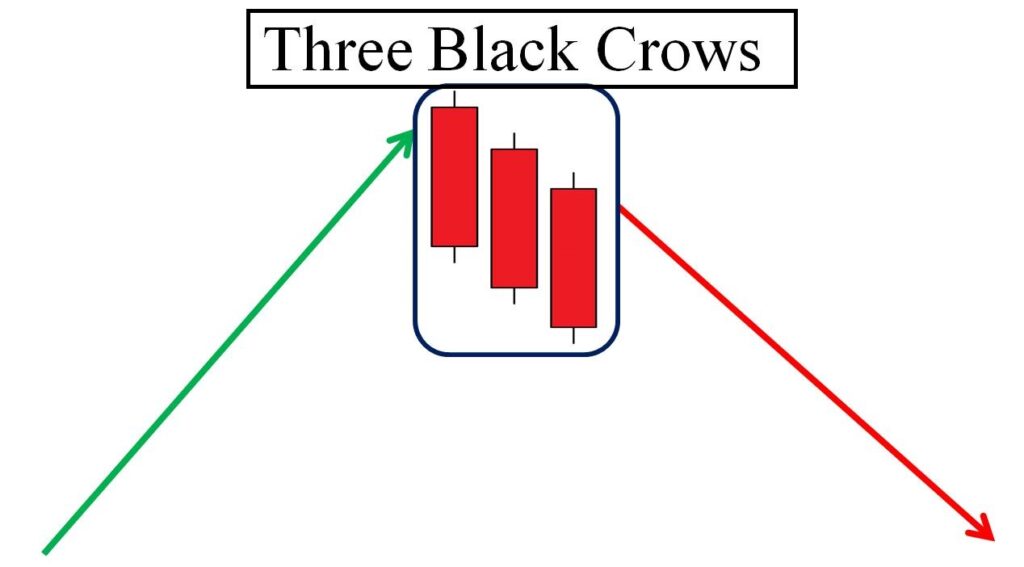
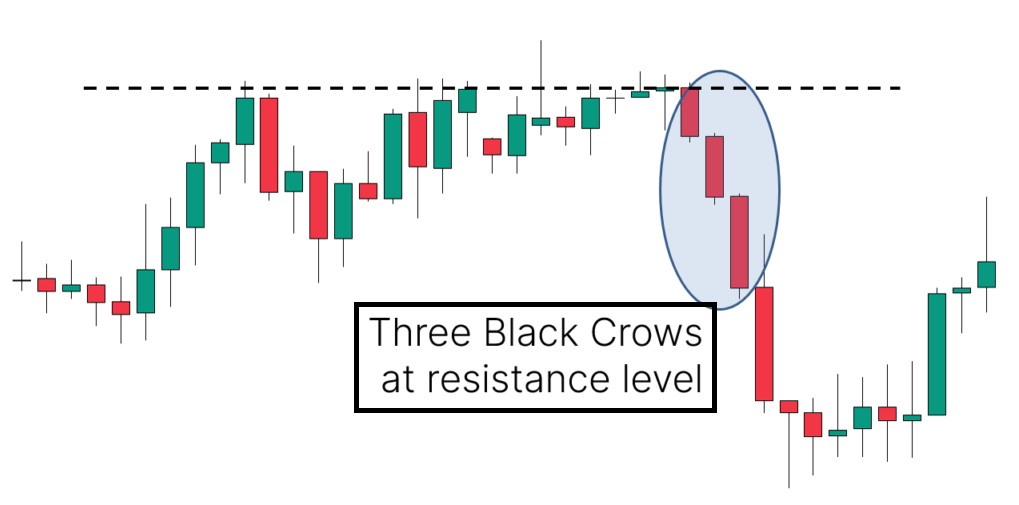
9. Three Black Crows
- Description: Three consecutive long bearish (red) candles, often with small or no wicks. It typically appears after an uptrend and signals strong selling pressure.
- Indication: This is a bearish continuation pattern, suggesting that the downtrend may continue.
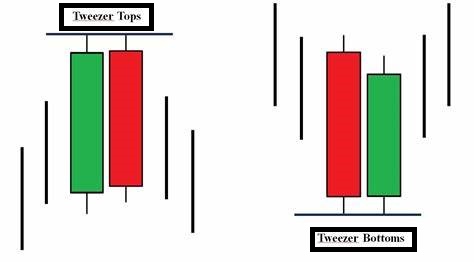
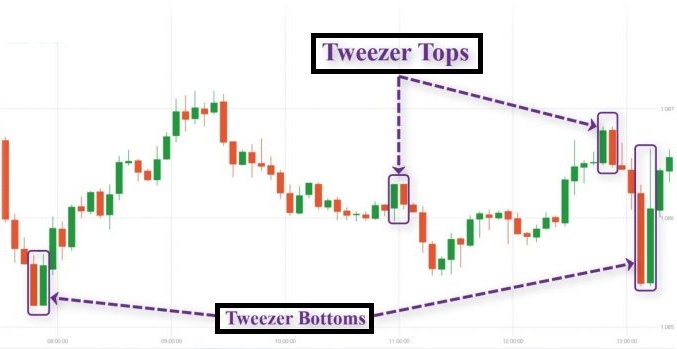
10. Tweezer Tops and Bottoms
- Tweezer Top: A two-candle pattern where both candles have similar highs and the second candle is bearish. It typically signals a reversal after an uptrend.
- Tweezer Bottom: A two-candle pattern where both candles have similar lows and the second candle is bullish. It typically signals a reversal after a downtrend.
—
Key Points to Remember:
1. Context is Crucial: Always analyze candlestick patterns within the context of the broader trend and other indicators (e.g., support/resistance levels, volume, moving averages, RSI).
2. Confirmation: After spotting a pattern, look for confirmation from subsequent candles or other technical indicators (e.g., volume increase, moving average crossover).
3. Risk Management: Use stop-loss orders and position sizing strategies to manage risk when trading based on candlestick patterns.
Candlestick patterns are powerful tools, but they should not be used in isolation. Combining them with other technical analysis methods (e.g., trend lines, support/resistance levels, volume) can improve the accuracy of your predictions.
Important Links
Join on Telegram
WhatsApp Group
Follow on Facebook
Welcome to this official website of JOBSINDIA
There are a lot of similar website namely JOBSINDIA, so be careful to click on other website. Use our official Url : https://jobsindia.org.in to visit our site. You can also connect with us on social media platforms like Facebook, Twitter, Instagram, Telegram, WhatsApp and YouTube.
Disclaimer
Information provided on JOBSINDIA is for informational purposes only and does not constitute financial, investment, or trading advice. All content on this site, including news, analysis, opinions, and recommendations, is based on publicly available data and is believed to be accurate at the time of publication. However, we make no representations or warranties regarding the accuracy, completeness, or reliability of any information on this website.
Investing in the stock market involves significant risk, and past performance is not indicative of future results. The value of investments can fluctuate, and you may lose money. You should consult with a qualified financial advisor or do your own research before making any investment decisions.
JOBSINDIA and its owners, employees, or affiliates are not liable for any losses, damages, or other consequences arising from the use or reliance on any information contained on this website.
By using this website, you acknowledge that you understand and agree to this disclaimer.

